Shopify Attribution Tools,
Compared.
Elevar, Triple Whale, Northbeam and Analyzify each price on a different axis: order volume times destinations, store GMV, traffic volume, and a plan fee. The same Shopify store therefore receives quotes an order of magnitude apart. Which tool is cheapest depends on which axis your store happens to sit high on.
What would your store pay?
Prices read on each vendor’s own pricing page on 25 September 2026, in USD (sources at the foot of the page). Only Elevar’s bill follows the two numbers you know; that is the point of this page.
Four Tools, Four Different Pricing Axes
This is the single most important thing to understand before you request a quote from any of them. The four tools do not merely charge different amounts. They charge for different things. One meters orders, one meters revenue, one meters traffic, and one charges a flat plan fee that your volume never moves.
| Tool | Meters | Entry point | What pushes the bill up |
|---|---|---|---|
| Elevar | Monthly order volume × number of destinations | $225/mo (Core) | Crossing an order tier, or adding one more ad platform |
| Triple Whale | Store GMV | Free plan; paid tiers quoted | Revenue growth, and unlocking the features the entry tier excludes |
| Northbeam | Traffic and data volume: pageviews, not revenue | From $1,500/mo (Starter) | Sessions and events ingested, regardless of what they earn |
| Analyzify | Plan tier, billed monthly or yearly | $145/mo, or $109/mo billed yearly | Moving from Standard to Plus |
Entry points read on each vendor's own pricing page (sources at the foot of the page). Northbeam's is the lowest figure its page names, beside a quote form; Triple Whale publishes no paid price.
The consequence is the useful part. Two stores with identical ad spend can receive quotes an order of magnitude apart, purely because of which axis they happen to sit high on. A high-traffic, low-average-order-value store (think a fast-moving consumables brand with a lot of browsing and a small basket) is punished hard by traffic-based pricing, because it generates enormous event volume for modest revenue. Flip it around: a low-traffic, high-average-order-value store, the sort selling a small number of expensive items to a narrow audience, is punished by GMV-based pricing, because it books a lot of revenue on very few sessions. And a store that sends its events to six or seven ad platforms is punished by destination-count pricing regardless of how many orders it takes, because the destination list is a second meter running alongside the first.
None of this shows up on a feature comparison. It only shows up when the quotes arrive and they are four figures apart for no reason anyone can immediately explain.
One Store, Four Very Different Quotes
Take a single hypothetical store and price it four ways. Assume 5,000 orders a month and roughly $500,000 in monthly GMV: an average order value around $100, which is an ordinary shape for a mid-sized direct-to-consumer brand. It is one store. Here is what it costs, using the reported figures:
| Tool | Reported cost for this store | Why it lands there |
|---|---|---|
| Elevar | $650/mo | 5,000 orders lands in the 10,000-order tier, with 4 destinations included |
| Triple Whale | Quote only | Paid tiers are priced on annual GMV and package, after a walkthrough |
| Northbeam | From $1,500/mo | The Starter figure, the lowest its page names; the quote is set by traffic |
| Analyzify | $109–$275/mo | Standard or Plus; the low end is Standard billed yearly, the high end Plus billed monthly |
Elevar and Analyzify figures are read from the vendors' pricing pages; Northbeam's starter figure is the one its page names before "contact us for a quote"; Triple Whale publishes no paid price. They show the shape of the difference, not quotes for your store.
The spread across the published figures in that table is almost fourteen to one, $109 against $1,500, for one store on one day. That is not a quality gradient. It is four companies metering four different quantities and one store that happens to sit differently on each meter. Before you compare features, work out which meter you are expensive on: it will tell you more about your eventual bill than any capability list will.
Three Price Conflicts, and How Each Was Settled
Earlier versions of this page carried three figures that other sources contradicted, and said so rather than pick the number that read best. Each has since been settled the only way that counts: by reading the vendor's own pricing page. The record stays here because other comparisons still repeat the losing figures.
- Elevar's plan structure. One source described a ladder priced on orders and destinations; an older one described $200 at 1,000 orders, $450 at 10,000 and $950 at 50,000, with per-order overages. The vendor's page shows the first: Core, Advanced, Premium and Elite, each with an order allowance and a destination count. The overage ladder is out of date.
- Northbeam's floor: $1,500 or $1,000. Its pricing page names $1,500 for Starter, beside a quote form. The lower figure is not on it.
- Analyzify's billing basis. A reported annual fee did not match the monthly figure. The page sells both: Standard at $145 a month or $1,305 a year, Plus at $275 a month or $2,475 a year. The old annual figure matched neither and is gone.
Elevar: The Tracking Pipeline
First, a corporate note that matters. Elevar has been sold through Audiense since July 2025, and the Shopify App Store listing now reads "Elevar by Audiense". If you are searching for documentation, pricing or support and finding two brand names, that is why. The product name has been retained as a sub-brand rather than retired, so both names appear across the vendor's own material. Anyone renewing a contract should confirm which entity they are contracting with.
How the pricing works. Two meters run at once: how many orders you process, and how many destinations you send events to. Destinations means ad platforms and analytics endpoints: Meta, Google, TikTok, Pinterest, a warehouse, and so on. Adding a channel can move you up a tier even if your order count has not moved an inch. This is unusual, and it is the single most common way people are caught out, because nobody expects switching on one more ad platform to change their subscription price.
| Plan | Price | Order allowance | Destinations |
|---|---|---|---|
| Core | $225/month | Up to 2,000 orders/mo | 2 destinations |
| Advanced | $650/month | Up to 10,000 orders/mo | 4 destinations |
| Premium | $1,250/month | Up to 30,000 orders/mo | 10 destinations |
| Elite | From $3,000/month | Higher volumes | Contact sales |
Ladder as published on the vendor's own pricing page, which now sits on audiense.com and is titled for both names. The entry price is also in this site's app record with its source link.
What only this tool does
Session Enrichment. This is the genuine differentiator, and none of the other three offer an equivalent. It stitches events, sessions and channel attribution together so that a returning anonymous visitor can be recognised across separate visits, and their behaviour connected into a single thread rather than three unrelated ones. For a store with a long consideration cycle: where somebody browses on Tuesday, reads reviews on Thursday and buys the following week: that stitching is the difference between three orphaned sessions and one attributable journey.
Two supporting capabilities are worth naming. The first is a managed server-side GTM container: the tagging infrastructure is provisioned and maintained as part of the product rather than left as an exercise for you. The second is a Chrome-extension event builder, which lets you define custom events by clicking elements on your storefront instead of editing theme code: genuinely useful if the person defining events is a marketer rather than a developer.
On positioning: it is a Shopify preferred partner for checkout extensibility, is reported to power tracking for over 6,500 direct-to-consumer brands, and was reported to hold a 4.6 rating from 138 App Store reviews. That is a real install base, not a startup.
Where it concretely falls short
- There is infrastructure to run. Because it is built on server-side GTM, there is a Google Cloud tagging server in your stack to provision, monitor and pay for. That is a real operational surface, and it is the only one of these four that adds one.
- Advanced configuration needs real GTM knowledge. The out-of-the-box container covers standard events well. Anything bespoke requires someone who genuinely understands tag manager, or paying for setup services on top of the subscription.
- Destination count is a pricing lever. Worth repeating because it is so unusual: adding an ad platform can raise your bill. Budget for the destinations you will want in twelve months, not the ones you have now.
- Communication around breaking changes. There are reported gaps in advance notice when tracking behaviour changes, which, for a component sitting in the path of your revenue data, is a meaningful risk to plan around.
Who it genuinely suits: stores where the tracking pipeline itself is the problem (events arriving late, incompletely or not at all) with in-house or agency GTM capability to exploit it, and roughly $5,000 a month or more in ad spend to justify the line item. If your problem is that you cannot read your data, this is the wrong tool; it moves data, it does not interpret it.
Triple Whale: The Operator Dashboard
How the pricing works. Tiers are set by store GMV, so the bill tracks revenue. Triple Whale's pricing page lists four plans: Free, Foundation, Automate and Enterprise. Only the free plan has a published price. When we read the page on 19 October 2026, Foundation and Automate showed a "Book a walkthrough" button and no figure, and the page's FAQ says every price is set by a combination of annual GMV and the package you choose, billed monthly or yearly with two months free. Until August 2026 the page published self-serve prices; it no longer does, so we do not quote one.
The single most useful warning on this page: the entry tier excludes creative analytics, customer journey reporting and the survey-based features. Those are, for most buyers, the actual reasons to buy the product. Ask for the quote on the tier that contains the features you came for, not the entry tier, because that is the number you will actually pay.
What only this tool does
A Shopify-native first-party pixel combined with post-purchase surveys. The surveys are the distinctive part: at checkout, the customer is asked directly where they heard about you, and that self-reported answer is blended with the pixel data. It is the only one of the four that collects a signal the ad platforms cannot see at all, because it comes from the customer's mouth rather than from a cookie. For channels that are structurally invisible to click-based attribution (podcast reads, influencer mentions, word of mouth) it is often the only evidence you will ever get.
The right mental model: this is an ecommerce operating dashboard with attribution inside it, not a tracking pipeline. People open it every morning. That is a different product category from the other three, and it is why comparing it feature-for-feature against a data-delivery tool produces nonsense.
Where it concretely falls short
- The entry tier is hollowed out. As above: creative analytics, journey reporting and surveys all sit above it. This is the most consequential thing to know before buying.
- The "Total Impact" model has been criticised for over-counting. A customer who clicks a Meta ad and then a Google search ad can have both channels credited in certain views. The result is a report where the channel contributions sum to more than the revenue actually earned, which produces confidence that is not warranted by the data.
- Blended CAC, not per-channel CAC. You get a customer acquisition cost for the business, not a defensible one per channel. If your question is "should I move budget from Meta to TikTok", a blended number cannot answer it. This is a real and specific limitation against Northbeam.
Who it genuinely suits: Shopify-first direct-to-consumer operators who want one dashboard to open each morning and a number to run the day from. Below roughly $30,000 a month in paid media, the honest recommendation is the free plan: the paid tiers are priced for stores whose media decisions are large enough that a percentage point of improvement covers the subscription.
Northbeam: The Measurement Layer
How the pricing works. This is the one that is priced on traffic and data volume rather than on revenue, which catches people out in the opposite direction from everything else here. Two stores earning identical revenue can be quoted very differently if one of them generates three times the pageviews. Contracts are annual. Northbeam's own pricing page names two figures: Starter at $1,500, beside "contact us for a quote", and Professional at $3,500 a month; Growth and Enterprise are custom. Third parties report that it rarely sells to stores below about $500,000 in monthly GMV; that is reported, not on its page.
What only this tool does
The Clicks + Deterministic Views model. Server-side ingestion feeds a multi-touch attribution engine that credits view-through conversions deterministically rather than inferring them, which is the substantive distinction, because view-through is where most attribution tooling quietly resorts to modelling and hopes nobody asks. Media mix modelling is available on the upper tiers for the channels that have no click at all.
It also reports per-channel customer acquisition cost. That sounds mundane until you try to make a budget reallocation decision with a blended figure and find you cannot. Per-channel CAC is precisely what Triple Whale does not give you, and it is the clearest functional line between the two.
Where it concretely falls short
- The price floor excludes most Shopify stores outright. This is not a criticism of the product so much as a statement of who it is for. For the large majority of stores, the conversation ends at the first number.
- It is analyst-led. The models need somebody whose actual job is to use them. Bought by a lean team with no analyst, the depth is dead weight: an expensive dashboard nobody has time to interrogate.
- Annual contracts, no monthly escape. If it turns out to be wrong for you in month three, you are still paying in month eleven.
- It does not work as a Shopify-only stack. The other three are comfortable being the whole of a Shopify store's tracking setup. This one assumes a multi-channel media mix around it, and delivers proportionally less value without one.
Who it genuinely suits: brands north of $10 million in annual revenue running multi-channel mixes that include TV, podcast or influencer spend, with an analyst on staff. If you buy media across channels that do not produce clicks, this is the category of tool built for that problem.
Analyzify: GA4, Done For You
How the pricing works. Two plans, each billed monthly or yearly. Analyzify Standard is $145 a month, or $109 a month billed yearly ($1,305 a year); Analyzify Plus is $275 a month, or $206 a month billed yearly ($2,475 a year). Server-side GTM setup is a separate one-time add-on. Earlier versions of this page quoted an annual figure third parties reported; Analyzify's own page does not show it, so it is gone.
What only this tool does
Done-for-you setup, included at no extra cost. Managed onboarding, migration and professional implementation are bundled into the fee rather than sold as a services add-on. That is the actual product. It is a service wrapped in an app, and the fee is best understood as buying an implementation, not a subscription. Every other tool here sells you software and leaves the configuration to you or your agency.
Technically, it adds more than ten events and parameters that GA4 does not capture natively on Shopify: collection views, coupon codes, variant IDs, which are exactly the dimensions you find yourself missing the first time you try to answer a real merchandising question in GA4.
Where it concretely falls short
The 99% purchase-tracking accuracy claim measures capture rate, not data quality. This deserves unpacking, because it is the most quietly misleading number in this whole category. The claim is that 99% of purchase events are captured. That is a statement about delivery. It says nothing whatsoever about what those events contain. Bot purchases are captured at 99% accuracy. Synthetic sessions are captured at 99% accuracy. Proxy traffic is captured at 99% accuracy. The figure is entirely accurate about what it measures, and entirely misleading about what most merchants assume it means, which is "99% of my analytics data is correct". A high capture rate on dirty input produces a high-fidelity record of dirty input.
- It is GA4-centric. The value proposition is a correctly configured GA4. If GA4 is not your reporting layer, if you live in a BI tool or in the ad platforms, most of that value evaporates.
- The true cost is often higher than the fee. It is commonly paired with Stape hosting for the server-side container, which can push genuine annual cost past $3,000. The headline annual figure is the software, not the setup.
- The reviewer base skews small-business. Worth weighing when reading ratings: the population rating it is not the population running complex multi-channel measurement.
Who it genuinely suits: teams with no in-house analytics capability who want GA4 configured properly once and then left alone. If the honest description of your situation is "we know our tracking is wrong and nobody here can fix it", the bundled implementation is worth more than any feature on the list.
The Four Side By Side
| Elevar | Triple Whale | Northbeam | Analyzify | |
|---|---|---|---|---|
| Priced on | Orders × destinations | GMV | Traffic volume | Plan tier |
| Entry price | $225/mo | Free; paid quoted | From $1,500/mo | $145/mo |
| Core job | Tracking pipeline | Operator dashboard | Measurement & modelling | Done-for-you GA4 |
| Unique capability | Session Enrichment | Post-purchase surveys | Deterministic views + per-channel CAC | Implementation included |
| CAC granularity | n/a: not a reporting tool | Blended only | Per-channel | n/a |
| Infrastructure burden | sGTM container to maintain | None | None | None, though often paired with Stape |
| Practical floor | ~$5k/mo ad spend | Free plan under ~$30k/mo spend | ~$500k/mo GMV | Any size |
Entry row: read on each vendor's own pricing page. The "practical floor" row is judgement and third-party reporting, not a vendor figure. Each entry price is also in the app pricing index with its source link.
When the Free CAPI Shield Route Is Better
The honest framing is that three of these four are not really competing with CAPI Shield at all, and pretending otherwise would be the easiest way to make this page untrustworthy.
Northbeam and Triple Whale are measurement and reporting layers. They exist to tell you what worked: to model, attribute and display. A free event-delivery pipeline does not do that and never will. If what you need is a daily operating dashboard, buy the dashboard. If what you need is a media mix model with per-channel CAC and deterministic view-through, buy the measurement platform. Neither of those problems is solved by getting events to Meta more reliably, and anyone telling you otherwise is selling something.
The overlap is with the other two. Elevar and Analyzify are both, at bottom, about getting events reliably to Meta Conversions API, GA4 and the rest of the destination list. That is exactly what CAPI Shield does, at $0 a month, using Make.com's free tier and no code. The platform endpoints themselves (Meta Conversions API, Google Enhanced Conversions, the TikTok Events API) are free to call. Nobody sells privileged access to them. What the paid tools sell around those endpoints is the configuration interface, the monitoring, the onboarding and somebody to call.
So the trade is specific and worth stating plainly. The free route costs you setup time and ongoing ownership: you build the connection, you watch it, and when a payload shape changes you are the one who notices. The paid route costs money and buys convenience, monitoring and support, plus, in Elevar's case, Session Enrichment, which the free route genuinely does not replicate, and in Analyzify's case, somebody else doing the implementation.
Some links below are affiliate links (marked sponsored). They fund the free
guides and never change a recommendation: our default pick on this page is a free tier.
How we test & disclose →
A reasonable decision rule: if your events are not arriving and you have the capacity to own a small integration, start free and see whether the delivery problem was the whole problem: that means opening a free Make.com account and following the CAPI Shield build. If it was, you have solved it for nothing. If it was not (if the real problem turns out to be that you cannot tell which channel earned the sale) then you were shopping in the wrong category anyway, and Northbeam or Triple Whale is where that conversation belongs.
- → CAPI Shield: free Meta server-side tracking via Make.com, no code.
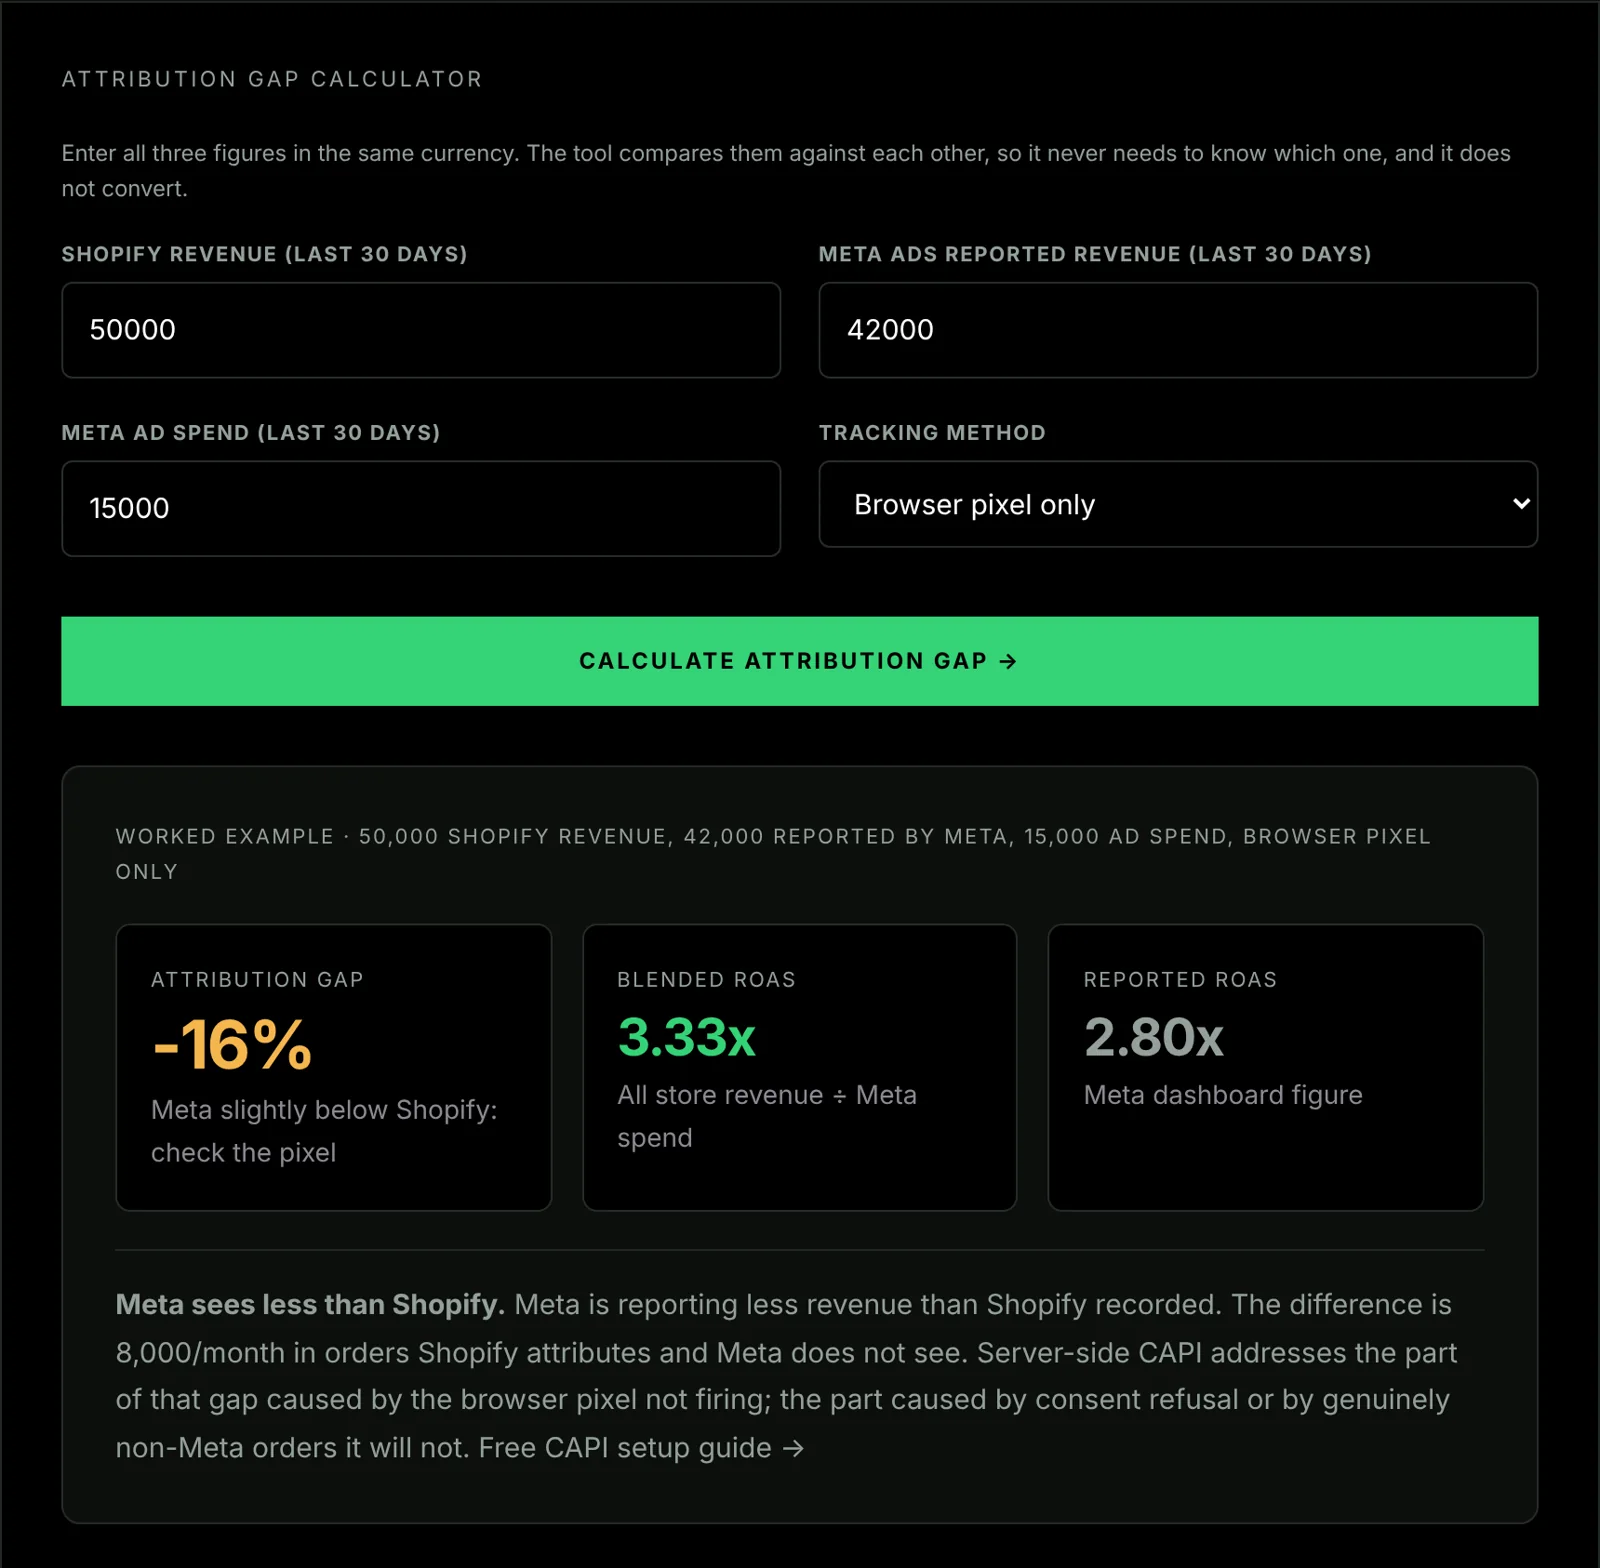
- → Attribution gap calculator: size the discrepancy before you buy anything to fix it.
- → Meta EMQ score estimator: check event match quality first; poor matching is often the real fault.
- → App pricing index: the tracked price record for each vendor, with source and date.
Common Questions
Which Shopify attribution tool is cheapest?
There is no single answer, because the four do not price on the same thing. Elevar prices on order volume multiplied by the number of destinations you send events to. Triple Whale prices on store GMV and package, and quotes its paid tiers after a walkthrough. Northbeam prices on traffic and data volume. Analyzify charges a plan fee, monthly or at a discount yearly. The cheapest tool is whichever axis your store happens to sit low on.
Why do two similar stores get completely different quotes?
Because the axis, not the store size, sets the price. A high-traffic, low-average-order-value store is penalised by Northbeam's traffic-based pricing while barely registering on Triple Whale's GMV tiers. A low-traffic, high-average-order-value store is the reverse. A store sending events to six ad platforms is penalised by Elevar's destination count no matter how few orders it takes.
Do Northbeam and Triple Whale compete with a free server-side setup?
Not directly. Northbeam and Triple Whale are measurement and reporting layers: they exist to tell you what worked. A free server-side event pipeline exists to get events delivered to the ad platforms. Elevar and Analyzify are the two of the four that genuinely overlap with it, because both are fundamentally about event delivery and configuration.
Is Analyzify's 99% purchase-tracking accuracy claim reliable?
The figure measures capture rate, not data quality. It describes the share of purchase events captured, not whether the contents of those events are trustworthy. Bot purchases, synthetic sessions and proxy traffic are captured at the same rate as real ones. The number is accurate about what it measures and misleading about what most merchants assume it means.
Are the prices on this page verified?
Yes, the prices are. Every price for Elevar, Northbeam and Analyzify was read on the vendor's own pricing page on 25 September 2026, and the sources are listed at the foot of the page. Triple Whale publishes no paid price, so none is given. A few non-price figures, such as install counts and the GMV a vendor typically sells to, are third-party reported and are labelled as reported where they appear.
How these figures were checked: prices come from each vendor's own pricing page, read on the date above, and only those prices are carried into structured data. Triple Whale's page shows no paid price, so this page gives none. Figures that are not prices (install counts, typical customer size) come from third parties and are marked reported where they appear. Our sourcing standard is in how we test.
Key facts, checked on the source
4 facts · read 19 October 2026In Shopify’s Facebook & Instagram app, the Enhanced and Maximum customer data sharing levels both send events through Meta’s Conversions API as well as the Meta pixel; the Standard level uses the pixel only.
Source: Shopify Help Center, Facebook data sharing, read .
Meta deduplicates a pixel event and a Conversions API event only when the event name and the event ID match, and it discards a repeat that arrives within 48 hours of the first.
Source: Meta for Developers, Deduplicate Pixel and Server Events, read .
Apple’s Link Tracking Protection, announced in June 2023 with iOS 17, removes tracking parameters from links in Mail, Messages and Safari Private Browsing.
Source: Apple Newsroom, Apple announces powerful new privacy and security features, read .
TikTok deduplicates a Pixel event and an Events API event only when both carry the same event name and the same event_id, and it matches duplicates within 48 hours of the first event.
Source: TikTok Ads Help Center, About event deduplication, read .
How to cite this page: Sandelands, L. (2026). Stack Architect. https://stackarchitect.xyz/shopify-attribution-tools-compared/ These facts are published as open data under CC BY 4.0: key-facts.json. Found one out of date? How we check and correct.

shopify-capi-validator npm package. Builds Shopify server-side tracking, Meta CAPI and Google Apps Script automations. Updated